

Nowadays, the importance of making informed decisions cannot be overstated. Power BI empowers businesses to gain a comprehensive understanding of their data and leverage it effectively. Consider this: when faced with a mountain of numbers, it can be challenging to extract meaningful insights. But is Power BI truly the optimal solution?
What is Power BI?
Power BI, a powerful business intelligence tool developed by Microsoft, enables users to transform raw data into visually appealing and interactive reports and dashboards, facilitating informed decision-making. These visuals help people see and understand what the data means.
Power BI Components
Power BI consists of Power BI Desktop (Microsoft Windows desktop), Power BI Service (SaaS), and Power BI Mobile apps for phones and tablets, available on Windows, iOS, and Android.
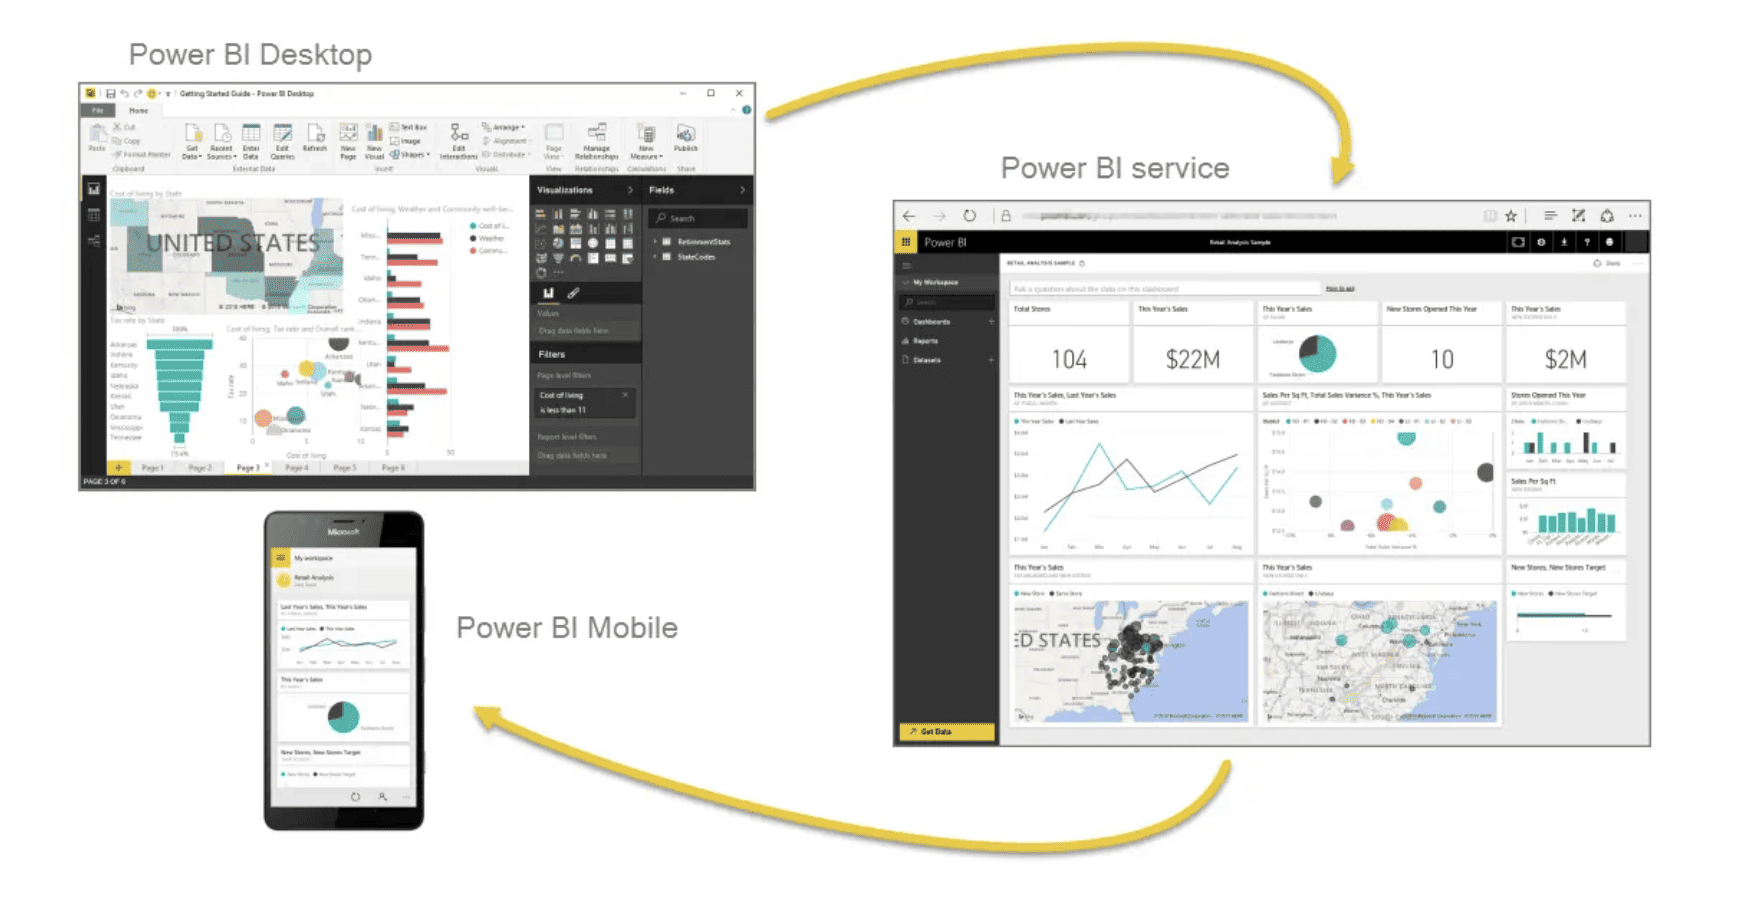
Source: learn.microsoft.com
Power BI Desktop
Power BI Desktop serves as the primary authoring and publishing tool, allowing users to create reports and dashboards with a user-friendly interface. It supports various data connectors, enabling seamless integration with diverse data sources.
Power BI Service
The Power BI Service is a cloud-based platform where users can publish, share, and collaborate on Power BI content. It enhances accessibility and enables real-time collaboration, making it a crucial component for organizations with distributed teams.
Power BI Mobile
Power BI Mobile extends the functionality of Power BI to smartphones and tablets, providing users with the flexibility to access reports and dashboards on the go. This ensures that decision-makers stay informed, regardless of their location.
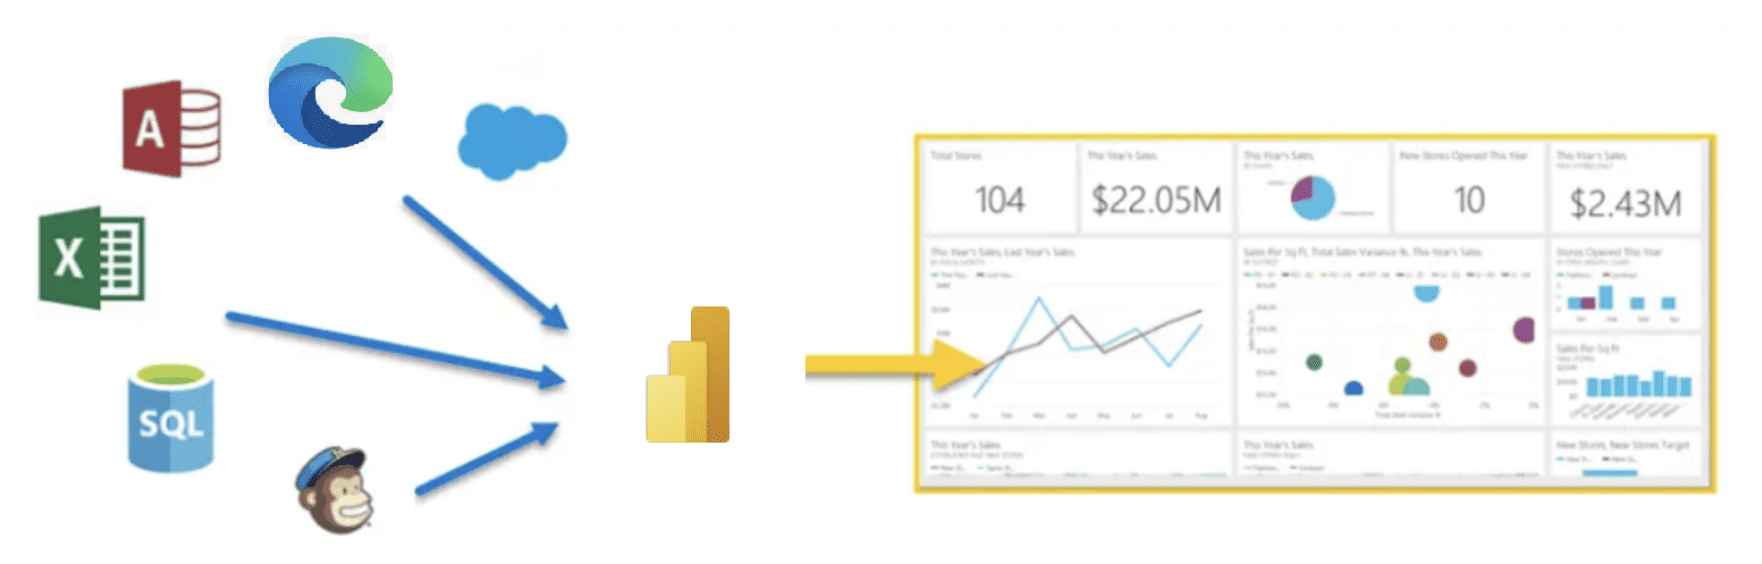
Connecting Data Sources
Power BI supports various data sources, including Excel, SQL databases, SharePoint, and more. Importing data into Power BI is a straightforward process, allowing users to quickly start their analysis.
For real-time data analysis, Power BI offers DirectQuery and Live Connection options. These features enable users to connect directly to the data source, ensuring that their reports reflect the most up-to-date information.
Making Special Calculations with Power BI
Power BI employs Data Analysis Expressions (DAX) for creating calculated columns and measures. DAX is a powerful formula language that enables users to perform complex calculations on their data.
1. Calculated Columns
Think of a spreadsheet where you have columns with numbers. A calculated column is like a new column you create, but instead of just copying the numbers, you can use DAX to make some fancy calculations. It’s like having a column that shows the result of your special math.
Example: If you have a column with product prices and another with the quantity sold, you can use DAX to create a new column that shows the total revenue by multiplying the price and quantity for each row.
2. Measures
Measures are like super smart calculations that you can use to analyze your data. Unlike calculated columns, measures don’t create new columns; they give you a single number that summarizes something important. It’s like having a special calculator that instantly gives you the answer to a specific question.
Example: If you have a column with sales data, you can use DAX to create a measure that shows the total sales. So, instead of scrolling through a long list of numbers, you just see one big number that tells you how much you’ve sold overall.
Building Visualizations
Power BI offers a wide array of data visualization types, including bar charts, line charts, pie charts, maps, and more. Choosing the right visualization for the data at hand enhances the clarity of insights.
- Customizing Your Visuals in Power BI: In Power BI, users can customize the appearance of their visualizations to align with specific branding or reporting requirements. This involves selecting formatting options, choosing color schemes, and more.
- Creating Dynamic Dashboards: Power BI users actively design dashboards, turning them into interactive canvases. They strategically arrange tiles, pinning visualizations and reports for a seamless user experience. This process includes configuring settings to ensure a customized and visually cohesive dashboard.
Power BI Integration with Other Tools
Source: learn.microsoft.com
- Integrating with Microsoft Office Suite: Power BI seamlessly integrates with other Microsoft Office applications, such as Excel and SharePoint. This integration enhances workflow efficiency for users familiar with the Microsoft ecosystem.
- Power BI and Azure Services: For organizations leveraging Azure services, Power BI offers seamless integration. This includes Azure Data Lake Storage, Azure SQL Database, and other Azure services, creating a comprehensive data analytics environment.
- Third-Party Integrations: Power BI supports integration with a variety of third-party tools and services, expanding its capabilities and compatibility with different data sources and systems.
How to Use Power BI
To access Power BI, you must first create an account.
Visit app.powerbi.com to get a free trial and register using your email address.

Source: app.powerbi.com
1. Install Power BI Desktop
Download and install Power BI Desktop, the application used for creating reports and visualizations.
To download Power BI desktop, you have two options:
- Windows Store App – Keeps itself updated automatically
- Download from web – Requires manual updates from time to time
2. Connect to Data
Open Power BI Desktop and connect to your data source. This could be an Excel file, a database, an online service, or other supported sources.
3. Data Transformation and Cleaning
Use Power Query Editor (within Power BI Desktop) to transform and clean your data if needed. This step ensures your data is in a format suitable for analysis.
4. Create Relationships and Data Model
Establish relationships between tables in your data. Build a data model by defining how different pieces of data are connected.
5. Create Calculated Columns and Measures (Optional)
Use Data Analysis Expressions (DAX) to create calculated columns or measures if you need to perform specific calculations or derive new insights.
6. Build Visualizations
Drag and drop fields onto the report canvas to create data visualizations like charts, tables, and maps. Power BI automatically creates visuals based on your data.
7. Customize Visuals
Customize the appearance of your visuals using formatting options, color schemes, and other design elements to make them visually appealing and aligned with your brand.
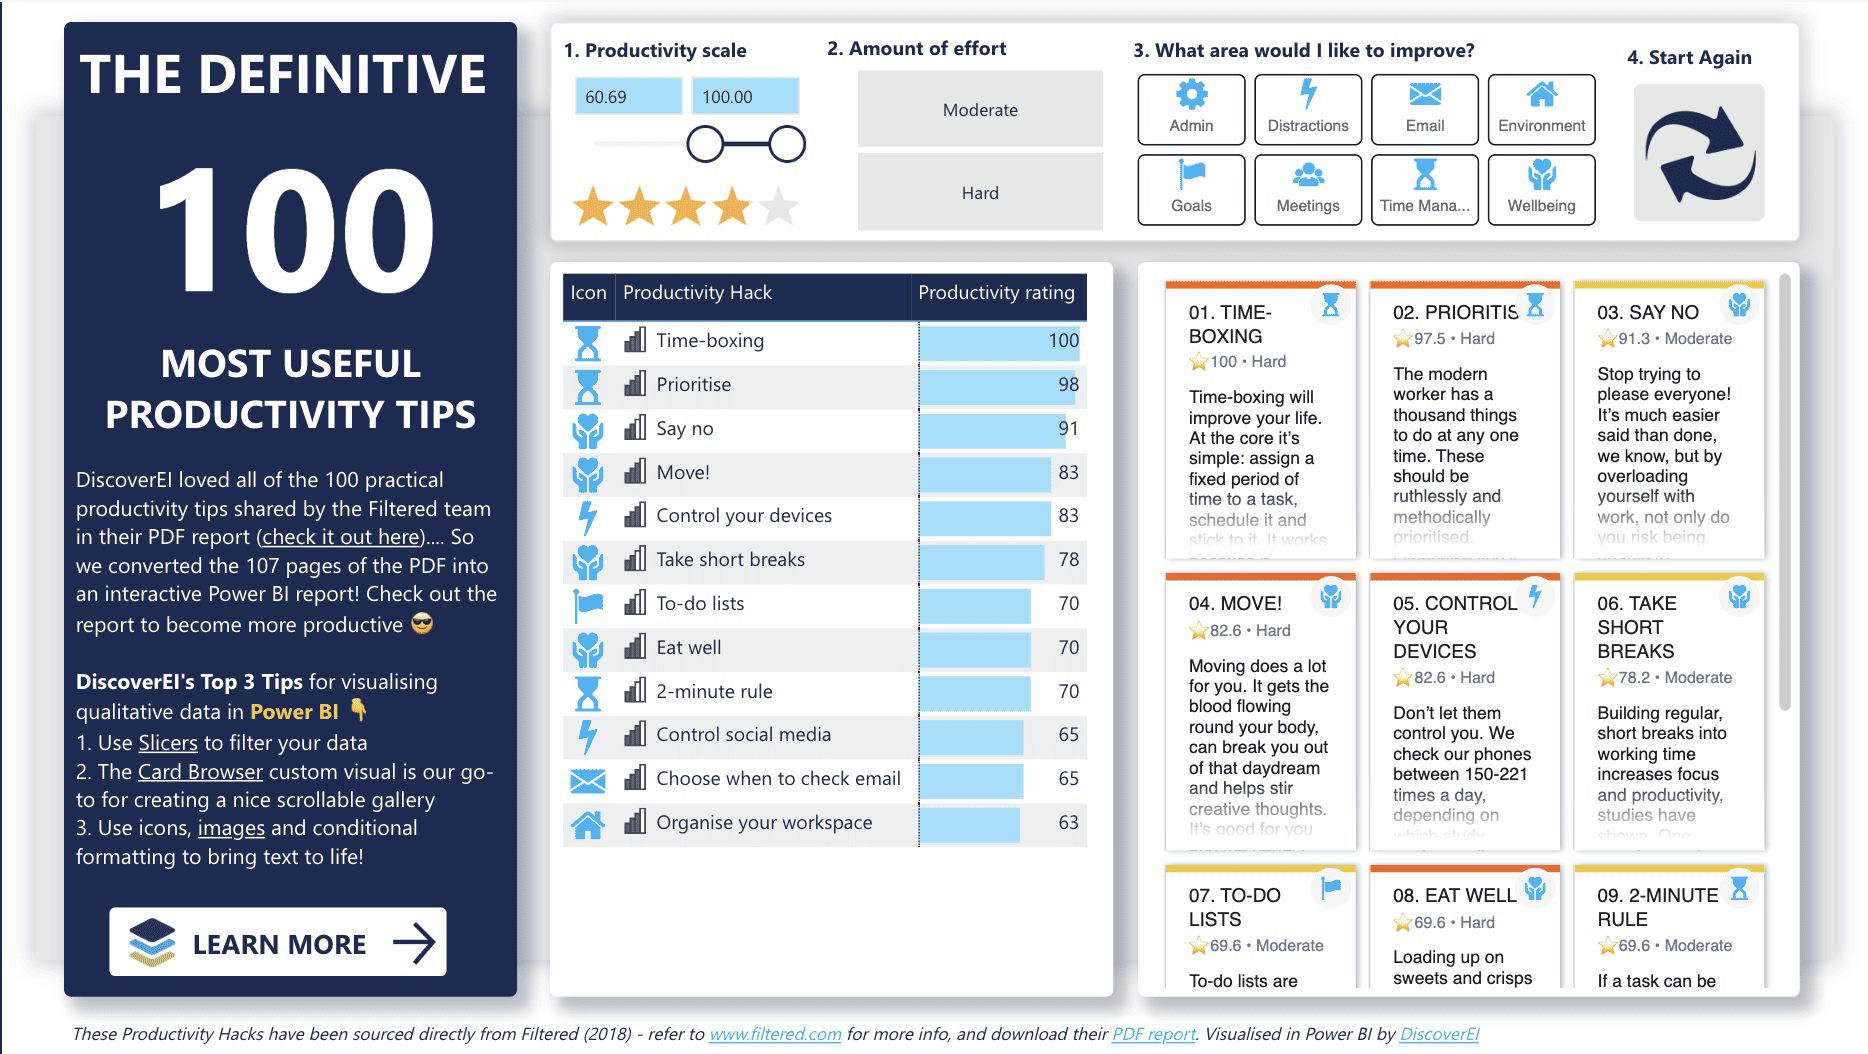
Sourcer: discoverie.com
8. Create Dashboards
Pin your visuals to create interactive dashboards. Arrange tiles strategically and configure settings for a seamless user experience.
9. Analyze and Explore Data
Use Power BI’s interactive features to analyze your data. Slice and dice information, drill down into details, and explore trends.
10. Share and Collaborate
Save your Power BI file and share it with others. Alternatively, you can publish your report to the Power BI service for online access and collaboration.
11. Access Power BI Service
Open the Power BI Service, a cloud-based platform. Upload your Power BI file and explore additional features like scheduled data refresh and sharing capabilities.
12. Create and Share Dashboards Online
Create dashboards online using Power BI Service. Pin visuals from different reports to the dashboard and share it with colleagues for collaborative decision-making.
13. Access Reports on Mobile
Download and use the Power BI Mobile app to access your reports and dashboards on mobile devices, ensuring you have data insights wherever you go.
For more details on the step-by-step guide, see “Sign in to Power BI service”.
What is Power BI used for?
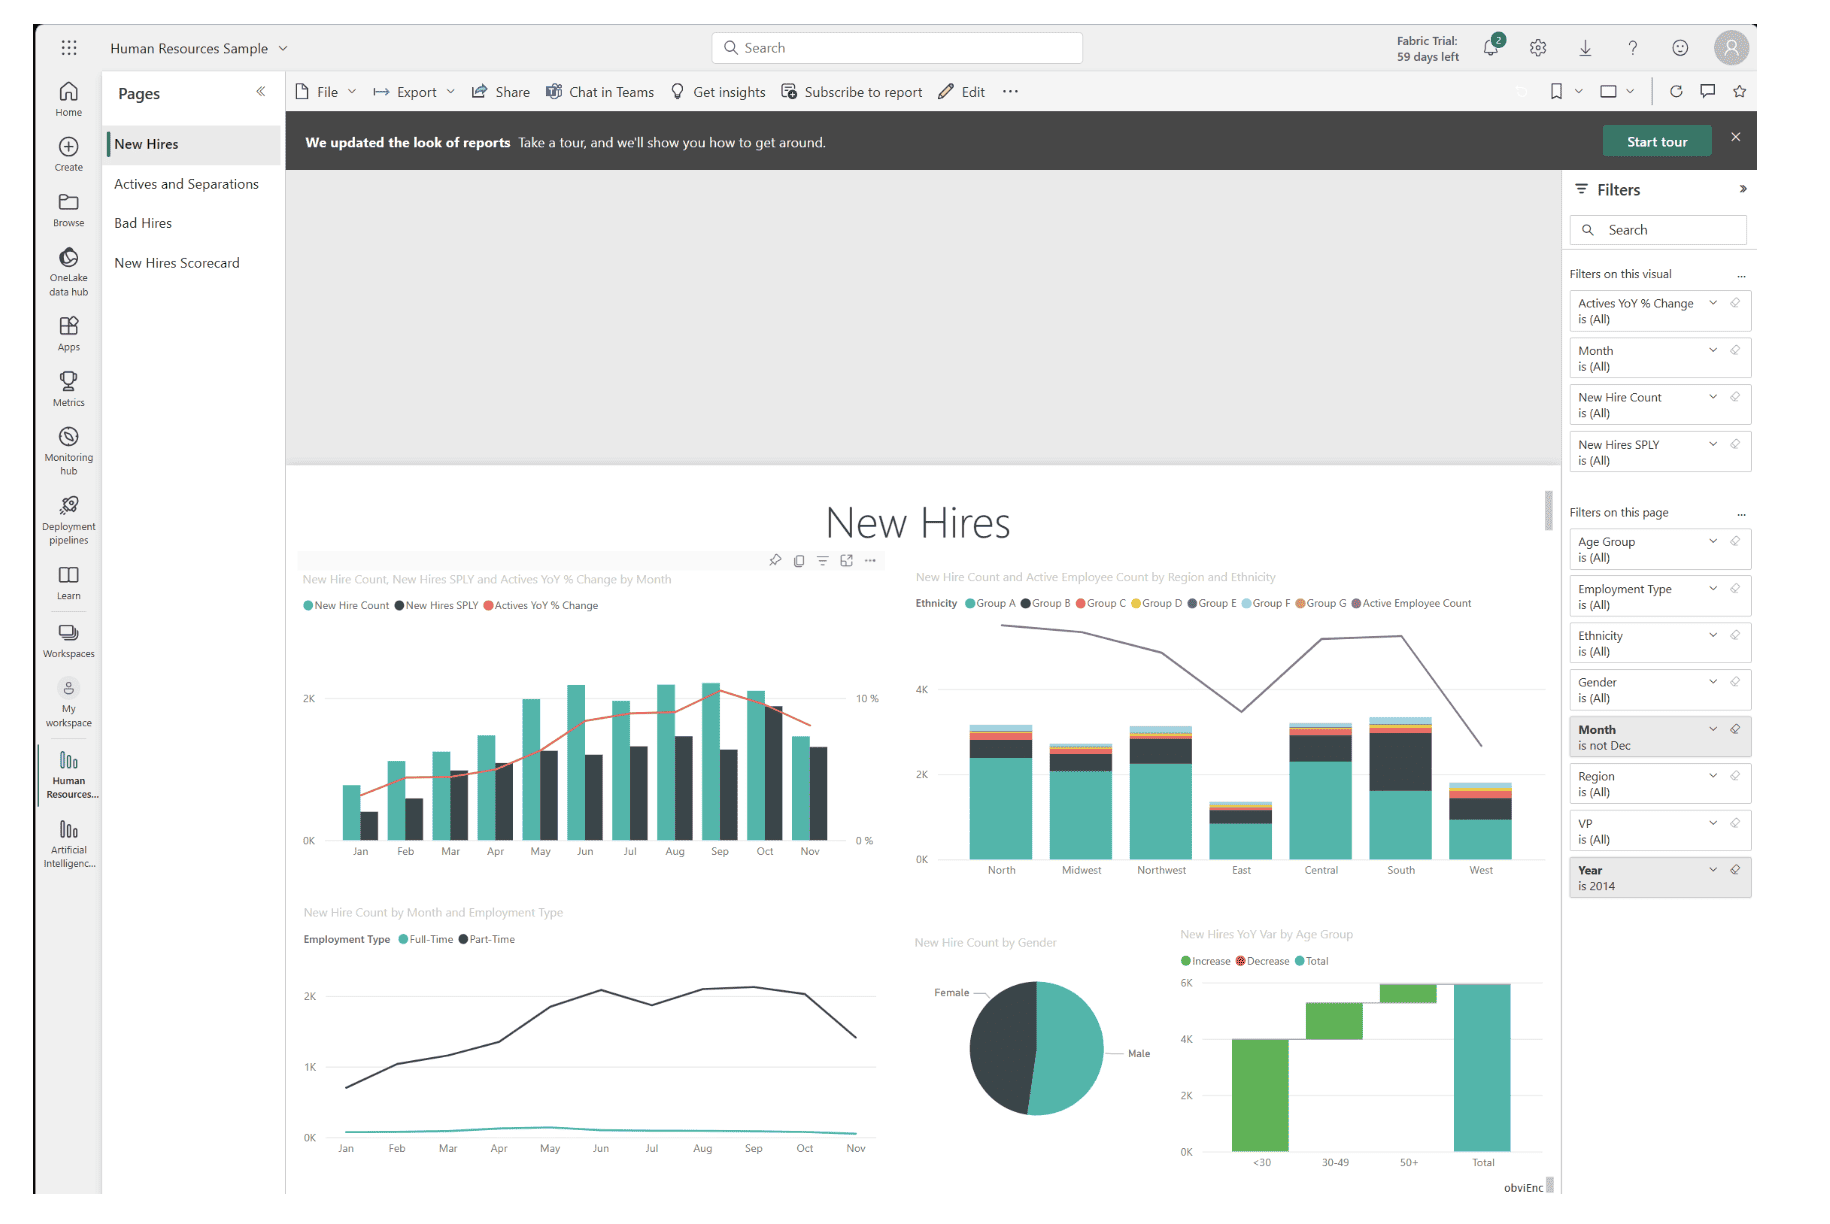
Source: learn.microsoft.com
Power BI can be used in various ways to analyze and visualize data, enabling individuals and organizations to make informed decisions. Here are several ways in which Power BI can be applied:
- Transform raw data into charts and dashboards for clear representation.
- Uncover insights in large datasets for strategic decision-making.
- Monitor KPIs in real-time for business assessment and improvement.
- Analyze financial data, create budgets, and track expenses for a comprehensive view.
- Visualize sales and marketing data to optimize strategies.
- Analyze inventory, supplier performance, and demand for a cost-effective supply chain.
- Track employee performance and analyze workforce trends with HR dashboards.
- Integrate Power BI with CRM for insights into customer interactions and preferences.
- Create financial forecasts, analyze variances, and support strategic planning.
Who uses Power BI?
Power BI is super easy to use—no need to be a genius! It’s designed for everyone, whether you’re an individual professional or part of a big organization. You can easily make smarter decisions using your data without any complicated tech stuff.
- Business Analysts
- Data Analysts and Scientists
- Business Intelligence (BI) Professionals
- IT Professionals
- Finance Professionals
- Sales and Marketing Teams
- Supply Chain Managers
- Human Resources Professionals
- Healthcare Professionals
- Educators and Researchers
- Project Managers
- Government & Non-profit Organizations
- Small to Large Enterprises
How does Power BI help businesses
Power BI helps businesses see patterns and trends in their data. This helps them make smarter decisions, like which products to sell more of, or where to open a new store.
1. Data Consolidation and Integration
Challenge: Businesses often deal with data scattered across various sources, making it challenging to get a comprehensive view.
How Power BI Helps: Power BI allows businesses to bring together data from multiple sources, whether it’s sales figures, customer information, or market trends. This consolidation enables a holistic analysis by providing a unified platform for all relevant data.
2. Visual Data Exploration
Challenge: Traditional data analysis methods may involve sifting through large datasets, making it difficult to identify meaningful insights.
How Power BI Helps: Power BI translates raw data into visualizations like charts, graphs, and dashboards. These visuals make it easy for business users to explore and understand trends intuitively, even without a background in data analysis.
3. Real-Time Analytics
Challenge: Making decisions based on outdated information can lead to missed opportunities or misguided strategies.
How Power BI Helps: Through features like DirectQuery and Live Connection, Power BI allows businesses to analyze data in real-time. This ensures decision-makers have the most current information, empowering them to respond promptly to market changes.
4. Predictive Analytics
Challenge: Businesses often face uncertainty about future trends and customer behaviors.
How Power BI Helps: Power BI’s integration with machine learning models facilitates predictive analytics. By analyzing historical data, businesses can use Power BI to predict future trends, helping them anticipate customer needs and make proactive decisions.
5. Identifying Profitable Products and Markets
Challenge: Deciding which products to focus on or which markets to target can be a complex task without proper insights.
How Power BI Helps: Power BI’s analysis capabilities enable businesses to identify top-performing products or lucrative markets. By visualizing sales data, inventory levels, and customer preferences, organizations can optimize their product offerings and strategically expand into new regions.
Let’s analyze your data with Power BI
Let’s be honest, doing it manually can be a pain. Installing, connecting, transforming, and building visuals, all while trying to navigate through complex data structures—it’s no walk in the park. Tech Efficiency Solutions is here to make everything easy and straightforward for you. Get a free consultation today and share with us how we can help.

Founder at Tech Efficiency Solutions
As a certified project management and software consultant, he improves business processes and tech systems and ensures every project is carried out flawlessly. He has years of experience working with various sectors including accounting, restoration services, startups, and non-profits.
Latest posts by Corby Haynes (see all)
- 5 Common Mistakes in SharePoint Governance and How to Avoid Them - June 5, 2024
- How to Use Microsoft Forms: A Beginner’s Guide - June 1, 2024
- What is Microsoft Bookings? - May 26, 2024