Power BI Desktop vs Service: What's the Difference?
- Corby Haynes
- February 14, 2024
- Time to read: 8 min

When it comes to data analysis and visualization, Power BI offers two major platforms: Power BI Desktop and Power BI Service. While both tools provide robust data handling capabilities, they serve different purposes and have unique features.
Let’s find out what sets these two apart from each other.
What is a Power BI Desktop?
Power BI Desktop, a free tool installed on your local computer, enables data analysis and report creation. It provides an array of visualizations, queries, and data modelling features that make it easy to connect to data sources, transform raw data into meaningful information, and build visually appealing reports.
Many organizations use Power BI Desktop for detailed report creation. For example, a retail company might use it to analyze sales data across various regions, visualize trends, and identify areas for improvement.
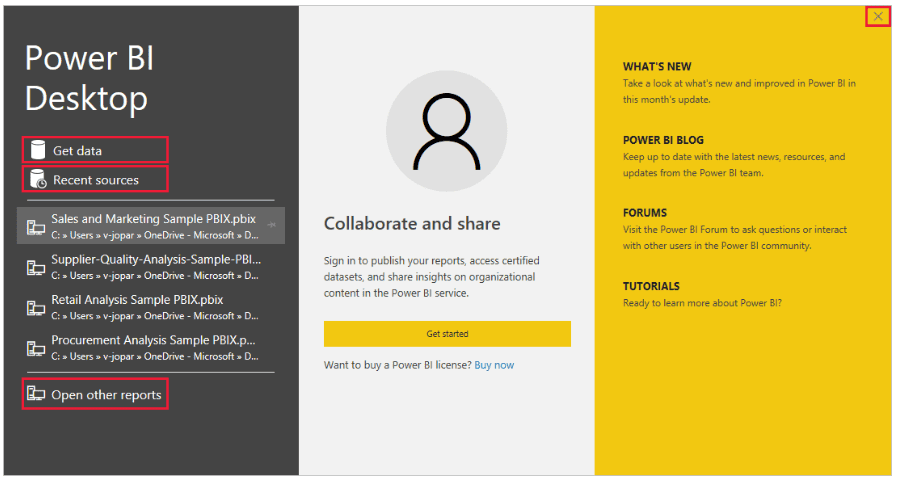
How Power BI Desktop Works
 Source: learn.microsoft.com
- Open Power BI Desktop and connect to your data source. This could be an Excel sheet, SQL Server database, or a cloud service like Azure SQL Database or Salesforce.
- Use Power Query to transform and shape your raw data. This could involve removing unnecessary columns, changing data types, or cleaning up values.
- Load the transformed data into the data model in Power BI Desktop.
- Look at the relationships between different data sets and manage them as needed. This is crucial for accurate reporting and analysis.
- Use the drag-and-drop canvas to create visualizations and reports based on your data model. You can choose from a variety of chart and graph options to best represent your data.
- Once you’ve created your reports, publish them to the Power BI service. This allows you to share your insights with others in your organization and collaborate on the data.
How to install and run Power BI Desktop
Step 1: Go to the official Microsoft Power BI website. Find the “Power BI Desktop” option and click on the “Download” button.
Step 2: Once the download is complete, locate the installer (usually in your Downloads folder), then double-click it to start the installation process.
Step 3: A setup wizard will guide you through the installation process. Click “Next” to proceed with each step. You will need to agree to the terms and conditions and select the location where you want to install the software.
Step 4: Click “Install” to begin the installation. This might take a few minutes. Once the installation is complete, click “Finish”.
Step 5: Find the Power BI Desktop application on your computer (usually on your desktop or in the programs list found in the Start menu) and double-click it to open.
Step 6: When you first launch Power BI Desktop, you will be prompted to sign in. Use your Microsoft account credentials to log in. If you don’t have an account, you will need to create one.
Step 7: Now that you are signed in, you can start using Power BI Desktop. You can import data, create reports, and perform various data analysis tasks.
Note: Always ensure your system meets the necessary requirements before installing any new software, and if you encounter any problems during the installation, visit the official Power BI help center for assistance.
To learn more, check Microsoft’s Get started with Power BI Desktop.
What is a Power BI Service?
Power BI Service, a cloud-based software as a service (SaaS), offers report editing and collaboration features for teams and organizations. It allows connection to data sources and supports the creation of dashboards, sharing apps, and data analysis to derive business insights. However, data modelling in the Power BI service is limited compared to Power BI Desktop. The capabilities you have access to in the Power BI service depend on your license.
How Power BI Service works
- Connects to various data sources from where it can pull data. These can include local databases, Excel files, cloud services, and more.
- Imports the data from these sources and allows you to transform or modify this data to suit your needs.
- Allows you to create relationships between different data sets, define new measures, and create hierarchies.
- Enables you to design interactive reports and dashboards using drag-and-drop visuals.
- Allows multiple users work on the same datasets and reports.
- Allows you to publish reports and dashboards to the Power BI service so that others can view and interact with them.
- Can schedule automatic data refreshes so your reports and dashboards always show the latest data.
- Enables you to share your reports and dashboards with others in your organization, either by sharing the content directly, publishing to the web, or embedding in an application or website.
How to use Power BI Service
Step 1: Go to the Power BI service website and sign in using your Microsoft account credentials. If you don’t have an account, you’ll need to create one.
Step 2: Click on “Get Data” at the bottom of the left navigation pane. You can choose from various sources like Excel, SQL Server, SharePoint, and more. Select the source you want and follow the prompts to connect and import your data.
Step 3: Once your data is imported, you can transform and clean it up as needed.
Step 4: In the left navigation pane, click on “Workspace”. Then click “Create” > “Report”. You can now start building your report by dragging fields onto your report canvas and choosing the visualization type that best represents your data.
Step 5: When you’re satisfied with your report, click “File” > “Save” to save your work. You can then share your report with others in your organization by clicking “Share” on the top right of the screen.
Step 6: Dashboards provide a consolidated view of many reports. To create a dashboard, click on “Workspace”, then “Create” > “Dashboard”. Name your dashboard and start pinning visuals from your reports.
Step 7: Once your dashboard is ready, you can publish it by clicking “File” > “Publish”. This will make the dashboard available to others in your organization. You can then share your dashboard just like you did with your report.
Power BI Desktop vs Power BI Service
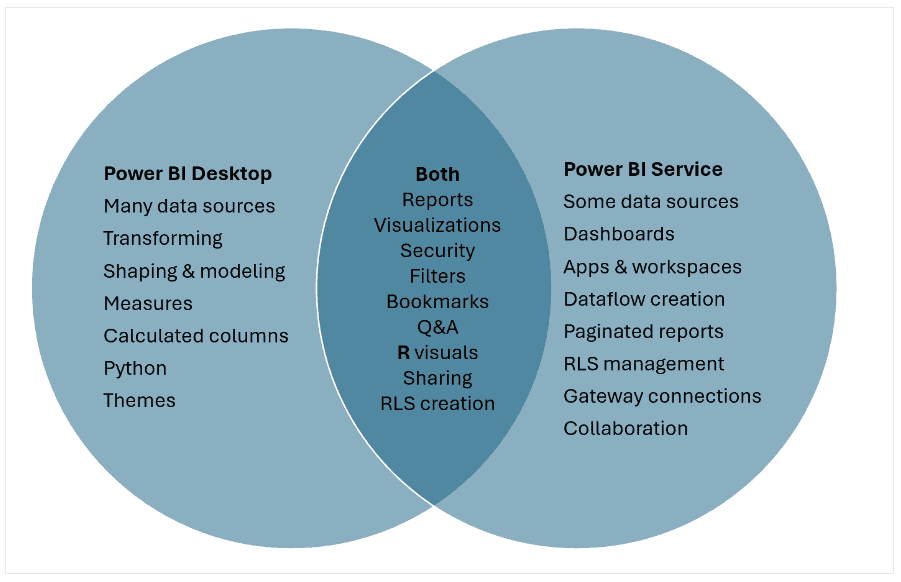
Power BI Desktop and Power BI Service serve different but complementary roles within the Power BI suite.
 Source: learn.microsoft.com
Functionality
Power BI Desktop is primarily a report creation tool. It’s designed for creating advanced, interactive reports and visualizations. It offers a wide range of tools for data modelling, data shaping, and visual design. This makes it ideal for analysts and other users who need to create detailed, complex reports from multiple data sources.
Power BI Service, on the other hand, is more focused on sharing and collaboration. While it also allows for report creation, its capabilities in this area are simplified compared to Power BI Desktop. The main strength of Power BI Service is that it allows users to publish reports created in Power BI Desktop, share these reports with others, and collaborate on them in real-time. This makes it an excellent tool for organizations where multiple users need to view and interact with reports.
Data Connection Capabilities
Power BI Desktop can connect directly to a wide range of data sources, including SQL Server, Excel, and many more. This makes it highly versatile and capable of handling complex data analysis tasks.
Power BI Service, while it can also connect to various data sources, relies on data gateways to connect to some types of data sources. This means that for certain types of data, a gateway must be set up by an administrator before the data can be accessed in Power BI Service.
User Interface
Power BI Desktop provides a rich, feature-packed interface designed around the task of creating reports. It includes a wide array of tools for manipulating data and designing visuals, making it a powerful tool for analysts.
In contrast, Power BI Service has a simpler, more streamlined interface. It’s designed primarily for viewing and interacting with published reports. This can make it easier to use for non-technical users who simply need to view and understand reports, rather than create them.
Overall, if your primary goal is creating intricate reports and visualizations, Power BI Desktop is your go-to tool. But if you need to share and collaborate on these reports, Power BI Service is indispensable.
A Quick Comparison Summary
Features | Power BI Desktop | Power BI Service |
Primary Use | Creating complex data models and detailed reports | Viewing, collaborating on, and sharing reports |
| Data Connection | Connects directly to a wide range of data sources | Connects to various data sources but relies on data gateways for some types |
User Suitability | Ideal for data analysts or those comfortable with advanced data manipulation | Ideal for decision-makers who need to view and interact with reports |
| Collaboration | Focused on individual report creation | Facilitates real-time collaboration and sharing of reports within a team |
Cost | Free tool | Comes with a subscription fee |
| Integration | Offers integration with various Microsoft products | Provides more seamless integration with cloud-based tools due to its cloud nature |
Note: Power BI Desktop and Service are not mutually exclusive but rather complementary. For instance, you can create detailed reports in Power BI Desktop, then publish and share them using Power BI Service for collaborative analysis and decision-making.
Work with Us
Whether you are just getting started or looking to enhance your current data analysis, Tech Efficiency Solutions can guide you every step of the way. Plus, as a Microsoft partner, we can seamlessly integrate Power BI with other Microsoft applications, providing you with a comprehensive and unified business solution. Reach out to us today for a free consultation.
Recommended read: What is Power BI and How to Use it?
FAQs
Q: What is a key advantage of using Power BI service over Power BI desktop?
One key advantage of using Power BI Service over Power BI Desktop is its collaborative nature. While the desktop version is excellent for individual report creation, the service version facilitates real-time collaboration, sharing of reports within a team, and publishing to a larger audience. This makes it ideal for decision-makers who need to view and interact with reports.
Q: What is the difference between Power BI service and Power BI server?
Power BI Service is a cloud-based business analytics service that provides interactive visualizations with self-service business intelligence capabilities. Users can share reports and dashboards, collaborate with colleagues, and publish to a larger audience.
On the other hand, Power BI Server is an on-premises solution for companies that don’t prefer to or can’t use cloud services due to regulations or data governance policies. It allows them to keep their data and reports entirely within their network.
Q: Is Power BI service free?
Power BI service comes with a version that’s free to use, but it has certain limitations such as data refresh frequency, data capacity, and collaboration features. For more advanced features and capabilities, there is a Pro version and a Premium version, both of which come with a subscription fee.
- 5 Common Mistakes in SharePoint Governance and How to Avoid Them - June 5, 2024
- How to Use Microsoft Forms: A Beginner’s Guide - June 1, 2024
- What is Microsoft Bookings? - May 26, 2024

